
使用canvas绘制环形进度条
更新时间: 2025-05-30 08:12:56
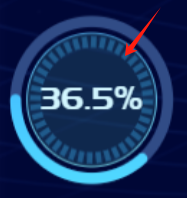
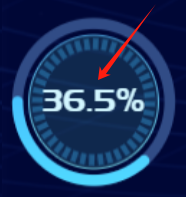
公司的新项目里有这样样式的环形进度条
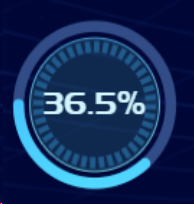
其实用svg也可以写,不过我更喜欢canvas,接下来我们一起开发出一个自适应宽高并且可以定义百分比的环形进度条
# 分析
首先分析一下,这个进度条有哪几部分组成:
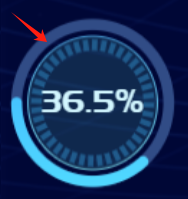
- 外圈进度条底色,可以用canvas的arc描边绘制
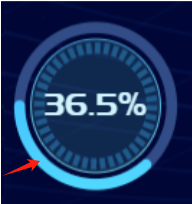
- 可以根据百分比变化的进度条本身,也可以使用canvas的arc描边绘制,线段的端点设置为圆形
- 内圈的细圆环,也是用canvas的arc描边绘制
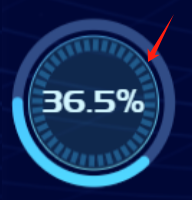
- 内圈的装饰刻度,用多个弧度较小的arc描边绘制而成
- 内圈的底色,用canvas的arc填充而成
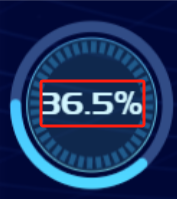
- 中间的文字,使用html+css,这个就没碧要也使用canvas了,使用canvas也可以,不过html比较方便
难点分析:
- 圆心的坐标计算起来虽然不难,但是可以将canvas的坐标系原点移动到画布的中心点上去,这样arc的圆心就是(0,0),更加的一目了然可读性更强
- 移动坐标系原点后,清除画布就应该是从 -width/2, -height/2 到 width/2, height/2,不然画布清除得就不干净
- 中间的装饰刻度的起止弧度的计算
- 各种数值都应该基于画布的宽高按比例来设置,以达到自适应
- 进度条有微微的渐变色
# 实现
# vue进度条组件的基础结构
<template>
  <div class="percent">
    <!-- 使用canvas需要先准备好canvas元素 -->
    <canvas ref="myCanvas"></canvas>
    <!-- 中间的文字用html+css实现 -->
    <div class="number">{{data}}%</div>
  </div>
</template>

<script>
export default {
    // data从外部传入
  props:{
    data: {
      type: Number,
      default: 0
    }
  }
}
</script>

<style scoped lang="scss">
.percent {
  width: 100%;
  height: 100%;
  position: relative;
  canvas{
    width: 100%;
    height: 100%;
  }
  .number {
    // 这里是自己加载的字体
    font-family: 'pmzdbtt';
    // 使用rem让字体大小自适应
    font-size: 1.2rem;
    line-height: 1.6rem;
    color: #D2F6FF;
    // 使用绝对定位和transform让文字居中
    position: absolute;
    left: 50%;
    top: 50%;
    transform: translate(-50%, -50%);
  }
}
</style>
1
2
3
4
5
6
7
8
9
10
11
12
13
14
15
16
17
18
19
20
21
22
23
24
25
26
27
28
29
30
31
32
33
34
35
36
37
38
39
40
41
42
43
44
45
2
3
4
5
6
7
8
9
10
11
12
13
14
15
16
17
18
19
20
21
22
23
24
25
26
27
28
29
30
31
32
33
34
35
36
37
38
39
40
41
42
43
44
45
# 初始化canvas并移动坐标系
<script>
//...
mounted() {
    this.init()
},
methods: {
    init() {
      // 设置canvas的宽高并取得上下文对象
      const canvas = this.$refs.myCanvas
      const width = canvas.clientWidth
      const height = canvas.clientHeight
      canvas.width = width
      canvas.height = height
      const ctx = canvas.getContext('2d')

      // 清除一次画布,其实可以不清楚,不过这是我的习惯性操作
      ctx.clearRect(0, 0, width, height)
      // 将translate变换中心点之前的状态存下来
      ctx.save()

      // 定位到中心点
      ctx.translate(width / 2, height / 2)
    }
}
</script>
1
2
3
4
5
6
7
8
9
10
11
12
13
14
15
16
17
18
19
20
21
22
23
24
25
2
3
4
5
6
7
8
9
10
11
12
13
14
15
16
17
18
19
20
21
22
23
24
25
如何变换canvas的中心点
ctx.translate(width / 2, height / 2)
1
记住要配合ctx.save()和ctx.restore()使用,方便让原点归位
# 绘制外圈圆底色
```vue
<script>
//...
watch: {
    data() {
        this.draw()
    }
},
mounted() {
    this.init()
},
methods: {
    //...
    init() {
      // 设置canvas的宽高并取得上下文对象
      const canvas = this.$refs.myCanvas
      const width = canvas.clientWidth
      const height = canvas.clientHeight
      canvas.width = width
      canvas.height = height
      const ctx = canvas.getContext('2d')

      // 清除一次画布,其实可以不清楚,不过这是我的习惯性操作
      ctx.clearRect(0, 0, width, height)
      // 将translate变换中心点之前的状态存下来
      ctx.save()

      // 定位到中心点
      ctx.translate(width / 2, height / 2)

      this.draw()
    },
    draw() {
      const canvas = this.$refs.myCanvas
      const width = canvas.clientWidth
      const height = canvas.clientHeight
      const ctx = canvas.getContext('2d')

      const PI = Math.PI
      // 最外圈的圆半径占整个宽度二分之一的70%
      const r = (width / 2) * 0.7
      // 清除画布这里需要用最新的坐标系了
      ctx.clearRect(-width/2, -height/2, width, height)
      // 设定描边的粗细
      ctx.lineWidth = width / 20;
      // 设定描边的颜色
      ctx.strokeStyle = '#314c86'

      // 路径开始
      ctx.beginPath()
      // 以0,0为原点,r为半径,0为起始角,2*Math.PI为结束角,顺时针画圆
      ctx.arc(0, 0, r, 0, 2 * PI, false);
      // 路径结束,以免影响后续的路径
      ctx.closePath()
      // 描边
      ctx.stroke();
    }
}
</script>
1
2
3
4
5
6
7
8
9
10
11
12
13
14
15
16
17
18
19
20
21
22
23
24
25
26
27
28
29
30
31
32
33
34
35
36
37
38
39
40
41
42
43
44
45
46
47
48
49
50
51
52
53
54
55
56
57
58
59
2
3
4
5
6
7
8
9
10
11
12
13
14
15
16
17
18
19
20
21
22
23
24
25
26
27
28
29
30
31
32
33
34
35
36
37
38
39
40
41
42
43
44
45
46
47
48
49
50
51
52
53
54
55
56
57
58
59
# 绘制内圈圆底色
需要先绘制底色,后面再绘制内圈的其它部分,以免产生错误的遮挡
draw() {
    //....
    // 设置填充颜色
    ctx.fillStyle = 'rgba(76, 168, 169, 0.20)';
    ctx.beginPath();
    ctx.arc(0, 0, r * 0.85, 0, 2 * PI, false);
    ctx.closePath()
    // 填充
    ctx.fill();
}
1
2
3
4
5
6
7
8
9
10
2
3
4
5
6
7
8
9
10
# 绘制内圈圆描边
    // 渐变色描边
    ctx.lineWidth = width / 100 > 1 ? width / 150 : 1
    const gradient = ctx.createLinearGradient(0, -height / 2, 0, height / 2);
    gradient.addColorStop(0, '#388FDB');
    gradient.addColorStop(1, '#81E0E1');
    ctx.strokeStyle = gradient;

    ctx.beginPath();
    ctx.arc(0, 0, r * 0.85, 0, 2 * PI, false);
    ctx.closePath()
    ctx.stroke();
1
2
3
4
5
6
7
8
9
10
11
2
3
4
5
6
7
8
9
10
11
# 画装饰刻度线
装饰刻度线我打算画40根,每根的线和空白一起占9度(360/40=9),然后线段占5度,空白占4度,代码如下:
ctx.lineWidth = width / 20;
ctx.strokeStyle = 'rgb(32,91,140)'
for (let i = 0; i < 40; i += 1) {
    ctx.beginPath();
    ctx.arc(0, 0, r * 0.74, (9 * i * Math.PI) / 180, ((9 * i + 4) * Math.PI) / 180, false);
    ctx.closePath();
    ctx.stroke();
}
1
2
3
4
5
6
7
8
2
3
4
5
6
7
8
# 根据百分比来画进度条
需要注意的是百分比为0的时候直接不用画
进度为100的时候,需要画成满圈,(1 - (num / 100))的计算结果需要等于1,所以num为0,
然后因为两端lineCap改成了圆形,因为百分比为97以上的时候,进度条看着就是满圈了,因此98,99得控制一下num都为97
if(this.data > 0) {
    ctx.save()
    // 画数据刻度
    ctx.lineCap = 'round';
    ctx.lineWidth = width / 20;
    const gradient1 = ctx.createLinearGradient(0, -height / 2, 0, height / 2);
    gradient1.addColorStop(0, 'rgba(86, 228, 255, 1)');
    gradient1.addColorStop(1, 'rgba(55, 165, 255, 1)');
    ctx.strokeStyle = gradient1;
    ctx.beginPath();
    ctx.rotate(Math.PI); // 旋转90度
    let num = this.data
    if(this.data > 97) {
        if(this.data >= 100) {
        num = 0
        }else {
        num = 97
        }
    }
    ctx.arc(0, 0, r, 0, 2 * PI * (1 - (num / 100)), true)
    ctx.stroke();
    ctx.closePath()
    ctx.restore()
}
1
2
3
4
5
6
7
8
9
10
11
12
13
14
15
16
17
18
19
20
21
22
23
24
2
3
4
5
6
7
8
9
10
11
12
13
14
15
16
17
18
19
20
21
22
23
24
# 最终代码
<template>
  <div class="percent">
    <canvas ref="myCanvas"></canvas>
    <div class="number">{{data}}%</div>
  </div>
</template>

<script>
export default {
  props:{
    data: {
      type: Number,
      default: 0
    }
  },
  watch: {
    data() {
      this.draw()
    }
  },
  data() {
    return {

    }
  },
  mounted() {
    this.init()
  },
  methods: {
    init() {
      const canvas = this.$refs.myCanvas
      const width = canvas.clientWidth
      const height = canvas.clientHeight
      canvas.width = width
      canvas.height = height
      const ctx = canvas.getContext('2d')

      ctx.clearRect(0, 0, width, height)
      ctx.save()

      // 定位到中心点
      ctx.translate(width / 2, height / 2)
      this.draw()
    },
    draw() {
      const canvas = this.$refs.myCanvas
      const width = canvas.clientWidth
      const height = canvas.clientHeight
      const ctx = canvas.getContext('2d')

      const PI = Math.PI
      const r = (width / 2) * 0.7

      ctx.clearRect(-width/2, -height/2, width, height)

      ctx.lineWidth = width / 20;

      ctx.strokeStyle = '#314c86'

      ctx.beginPath()
      // 以0,0为原点,r为半径,0为起始角,2*Math.PI为结束角,顺时针画圆
      ctx.arc(0, 0, r, 0, 2 * PI, false);
      ctx.closePath()
      ctx.stroke();

      ctx.fillStyle = 'rgba(76, 168, 169, 0.20)';
      ctx.beginPath();
      ctx.arc(0, 0, r * 0.85, 0, 2 * PI, false);
      ctx.closePath()
      ctx.fill();

      ctx.lineWidth = width / 100 > 1 ? width / 150 : 1
      const gradient = ctx.createLinearGradient(0, -height / 2, 0, height / 2);
      gradient.addColorStop(0, '#388FDB');
      gradient.addColorStop(1, '#81E0E1');
      ctx.strokeStyle = gradient;

      ctx.beginPath();
      ctx.arc(0, 0, r * 0.85, 0, 2 * PI, false);
      ctx.closePath()
      ctx.stroke();

      // 画时针刻度线

      ctx.lineWidth = width / 20;
      ctx.strokeStyle = 'rgb(32,91,140)'
      for (let i = 0; i < 40; i += 1) {
        ctx.beginPath();
        ctx.arc(0, 0, r * 0.74, (9 * i * Math.PI) / 180, ((9 * i + 4) * Math.PI) / 180, false);
        ctx.closePath();
        ctx.stroke();
      }
      if(this.data > 0) {
        ctx.save()
        // 画数据刻度
        ctx.lineCap = 'round';
        ctx.lineWidth = width / 20;
        const gradient1 = ctx.createLinearGradient(0, -height / 2, 0, height / 2);
        gradient1.addColorStop(0, 'rgba(86, 228, 255, 1)');
        gradient1.addColorStop(1, 'rgba(55, 165, 255, 1)');
        ctx.strokeStyle = gradient1;
        ctx.beginPath();
        ctx.rotate(Math.PI); // 旋转90度
        let num = this.data
        if(this.data > 97) {
          if(this.data >= 100) {
            num = 0
          }else {
            num = 97
          }
        }
        ctx.arc(0, 0, r, 0, 2 * PI * (1 - (num / 100)), true)
        ctx.stroke();
        ctx.closePath()
        ctx.restore()
      }
    }
  }
}
</script>

<style scoped lang="scss">
.percent {
  width: 100%;
  height: 100%;
  position: relative;
  canvas{
    width: 100%;
    height: 100%;
  }
  .number {
    font-family: 'pmzdbtt';
    font-size: 1.2rem;
    position: absolute;
    left: 50%;
    top: 50%;
    line-height: 1.6rem;
    color: #D2F6FF;
    transform: translate(-50%, -50%);
  }
}
</style>
1
2
3
4
5
6
7
8
9
10
11
12
13
14
15
16
17
18
19
20
21
22
23
24
25
26
27
28
29
30
31
32
33
34
35
36
37
38
39
40
41
42
43
44
45
46
47
48
49
50
51
52
53
54
55
56
57
58
59
60
61
62
63
64
65
66
67
68
69
70
71
72
73
74
75
76
77
78
79
80
81
82
83
84
85
86
87
88
89
90
91
92
93
94
95
96
97
98
99
100
101
102
103
104
105
106
107
108
109
110
111
112
113
114
115
116
117
118
119
120
121
122
123
124
125
126
127
128
129
130
131
132
133
134
135
136
137
138
139
140
141
142